

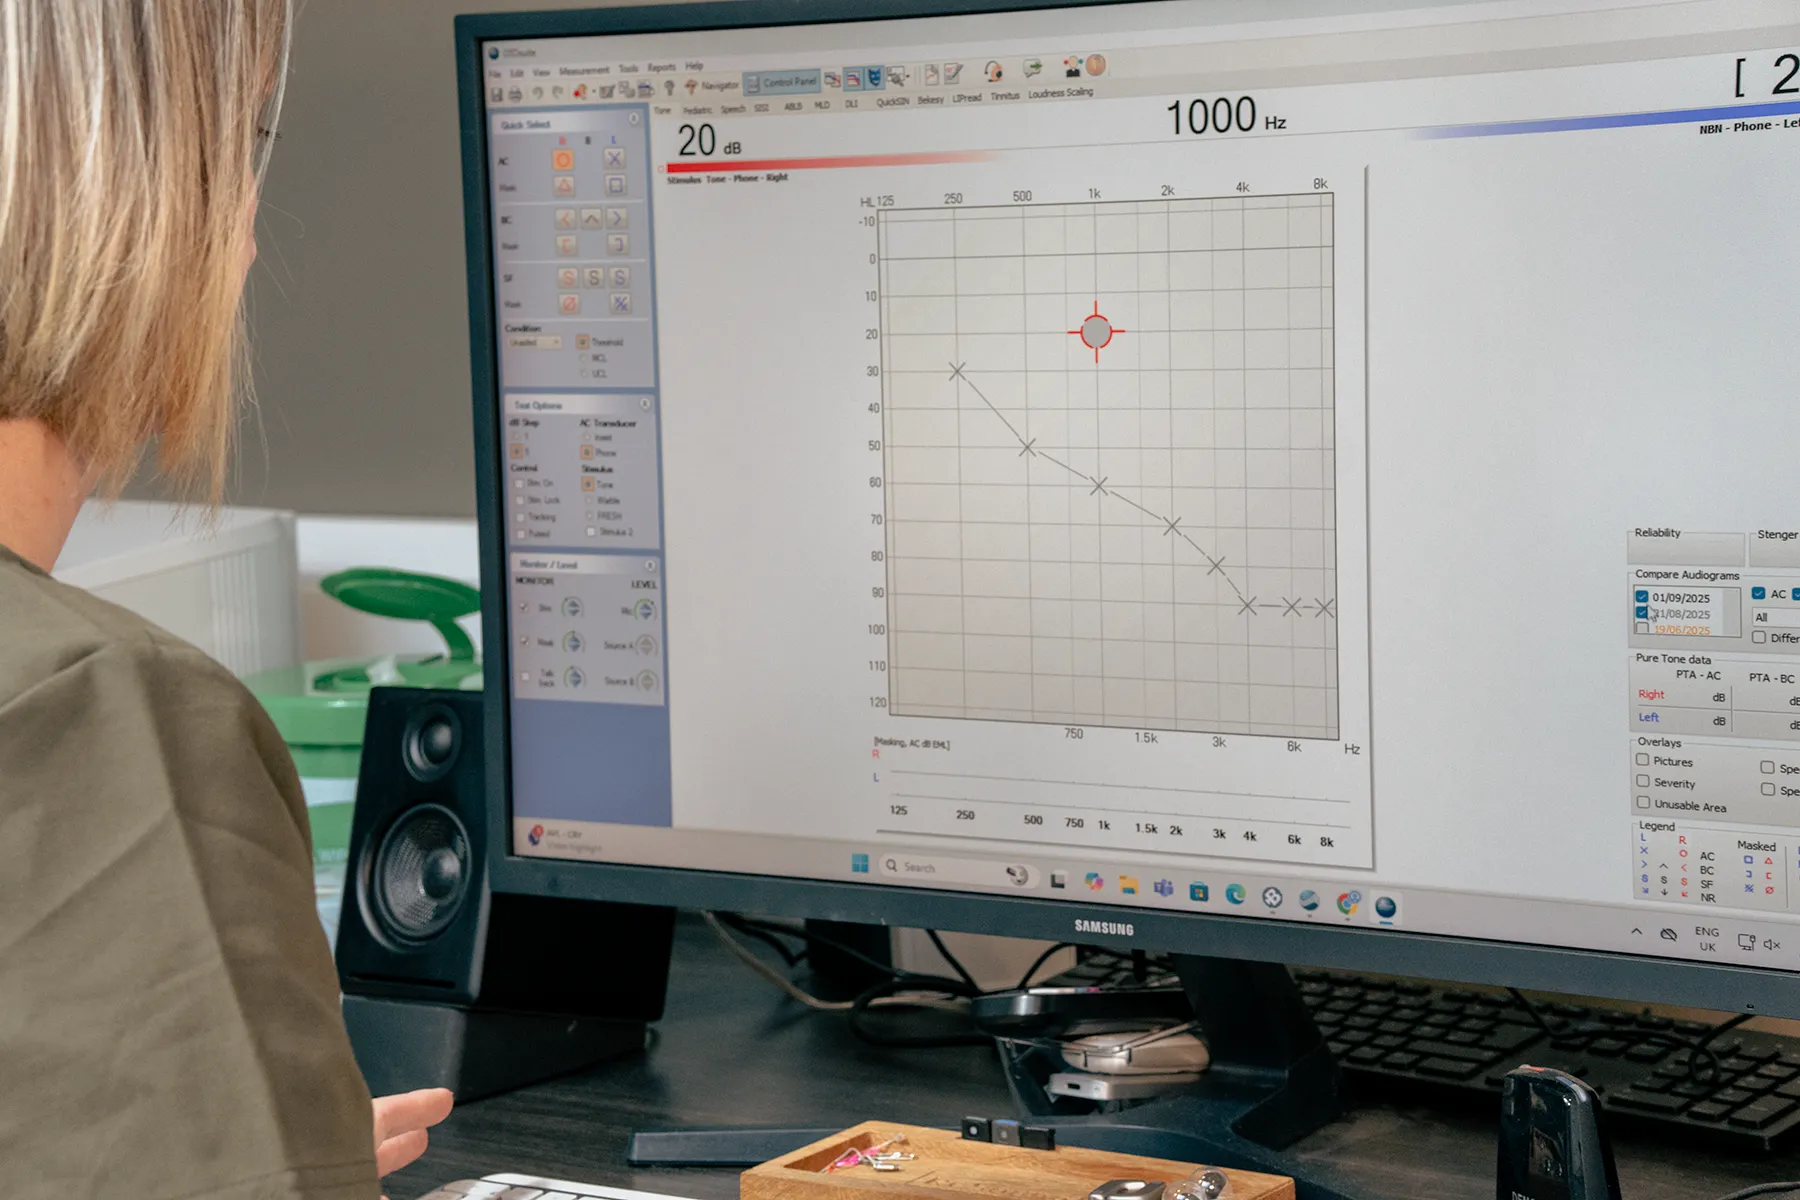
An audiogram is the graph from your hearing test. It shows the softest sounds you could hear at different pitches in each ear.
If you have a copy of your results, keep it beside you. Adam’s video and the example below explain the numbers and symbols, and how to read the pattern on the chart.
Watch Adam explain the audiogram
Adam explains how to read the graph and why the severity of a hearing loss can tell a different story from the person’s daily experience.
Go to reading the graph, severity and daily difficulty or what the audiogram cannot show.
In this article
How to read your audiogram
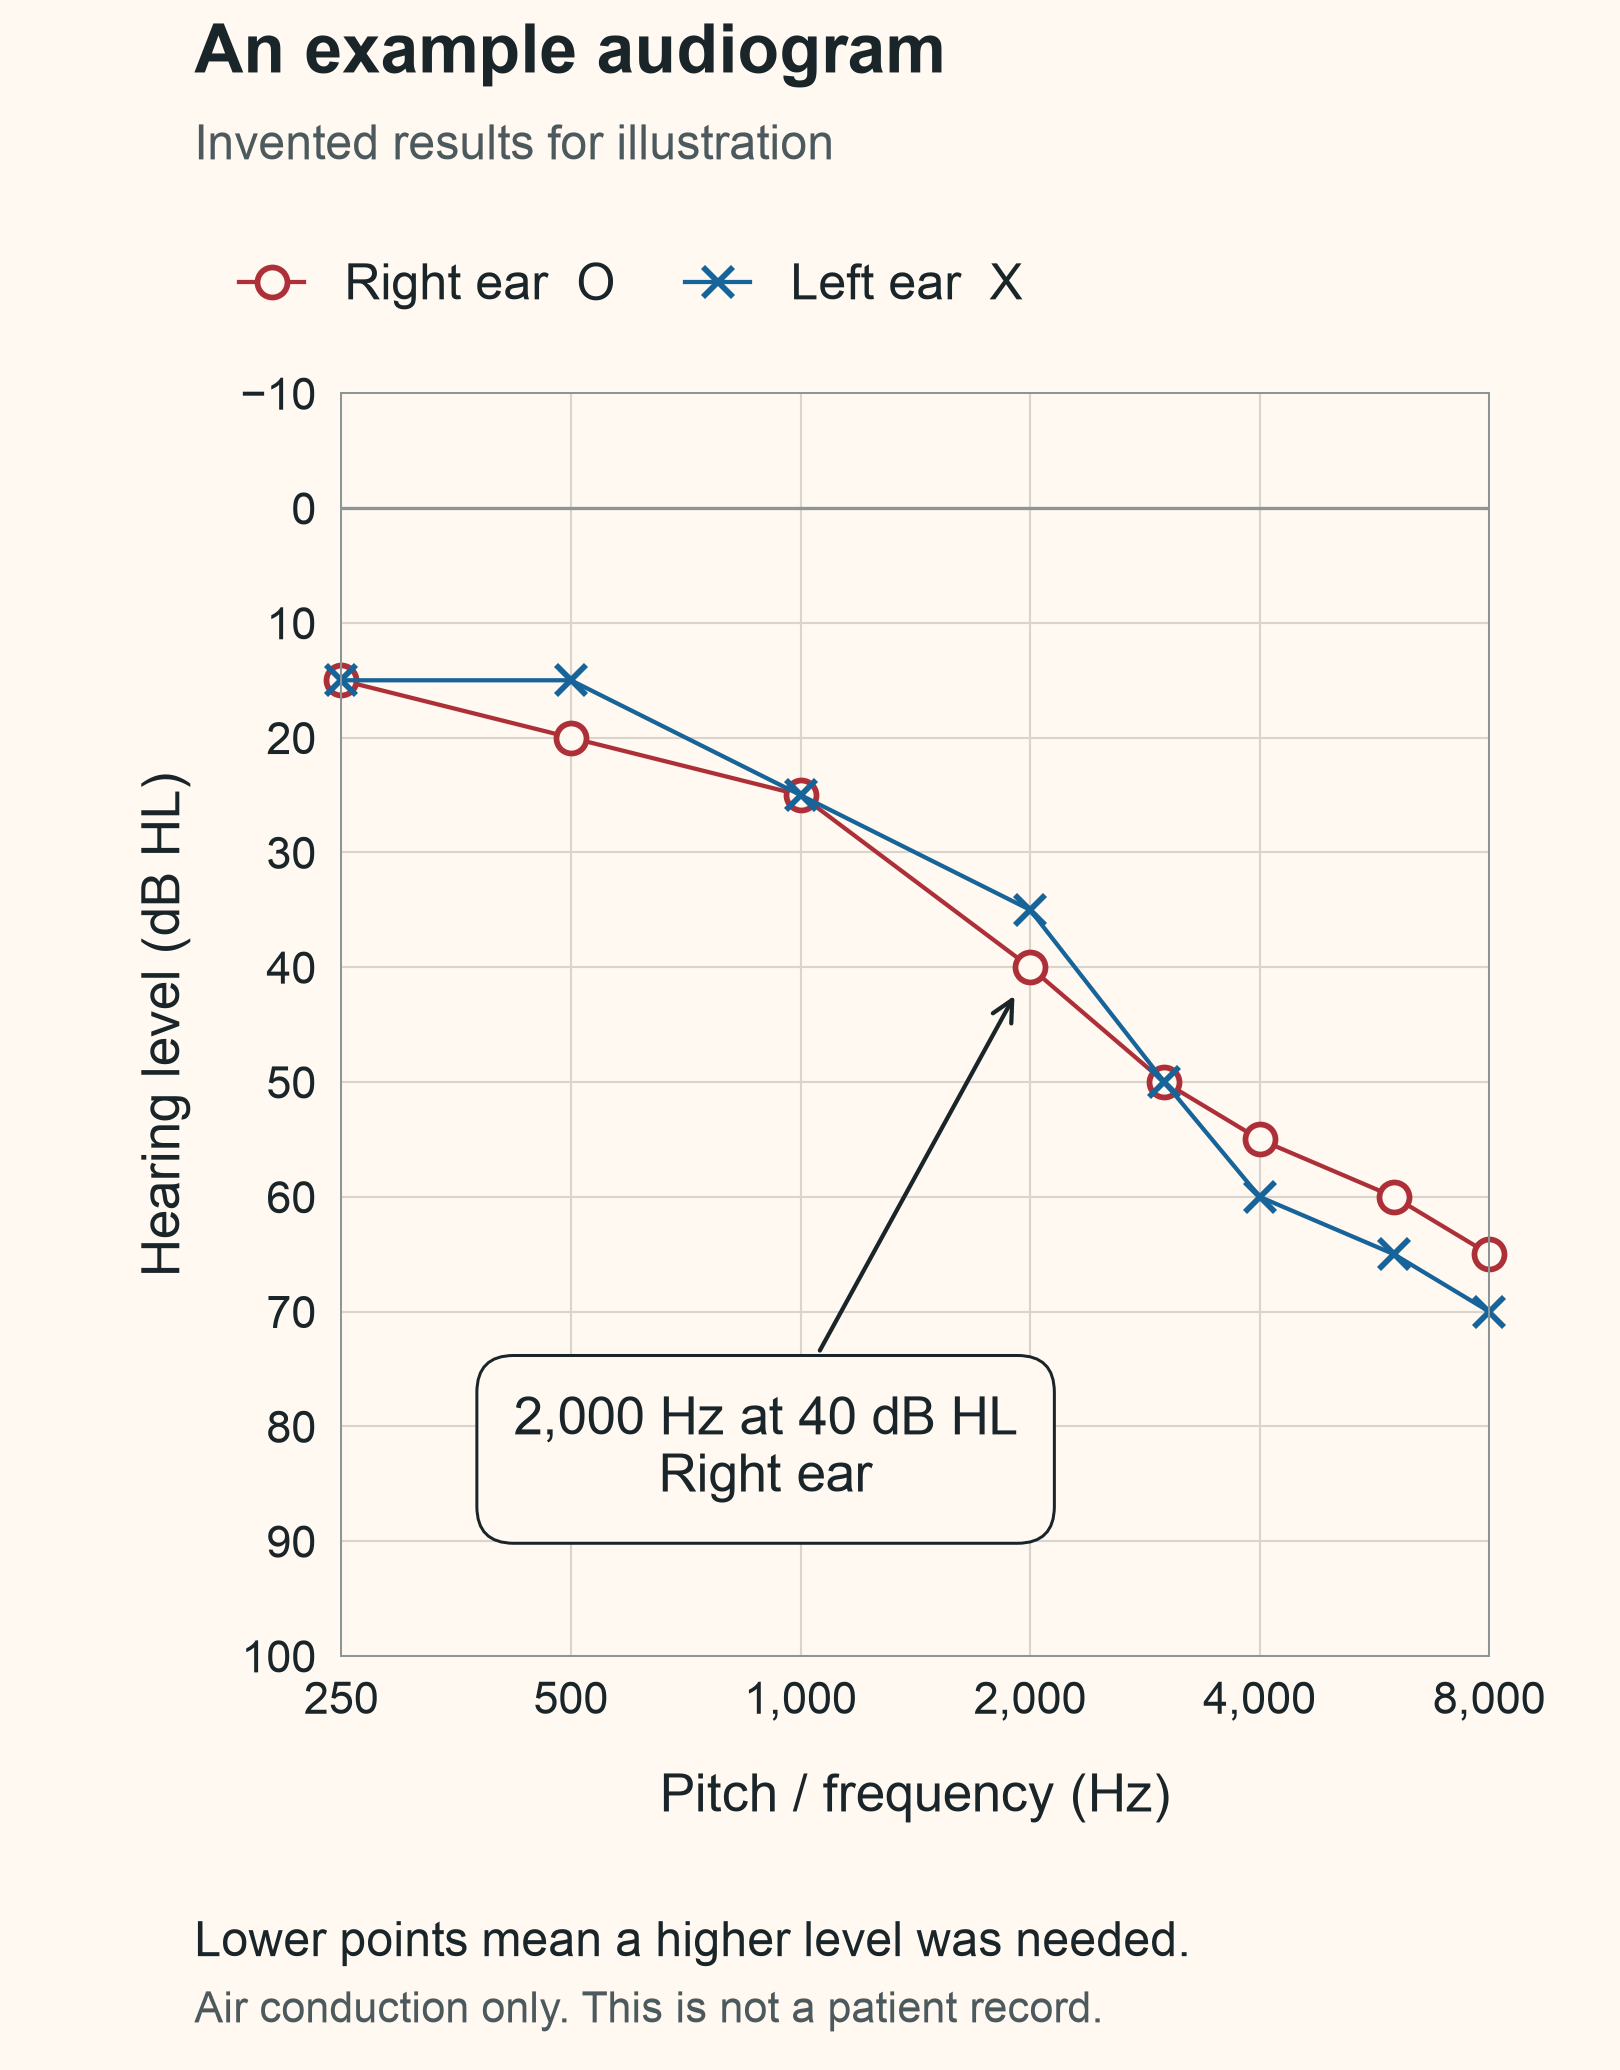
Pitch runs across the chart, measured in hertz (Hz). Lower pitches are on the left and higher pitches on the right. Hearing level runs down the side in decibels, written as dB HL.
A point near the top means you heard a softer test sound. A point lower down means the tone needed to be louder. Each point records your hearing threshold at that pitch.
Reading one result
At 2,000 Hz, the red circle sits at 40 dB HL. The softest tone recorded for the right ear at that pitch was 40 dB HL.
That is a sound level, not 40% hearing loss. And 0 dB HL is a reference for hearing sensitivity, not complete silence.
The example slopes down towards the higher pitches. That means more level was needed to hear those tones.
Your results may have a different pattern. The audiologist should explain which pitches are affected and how the two ears compare.
What the symbols mean
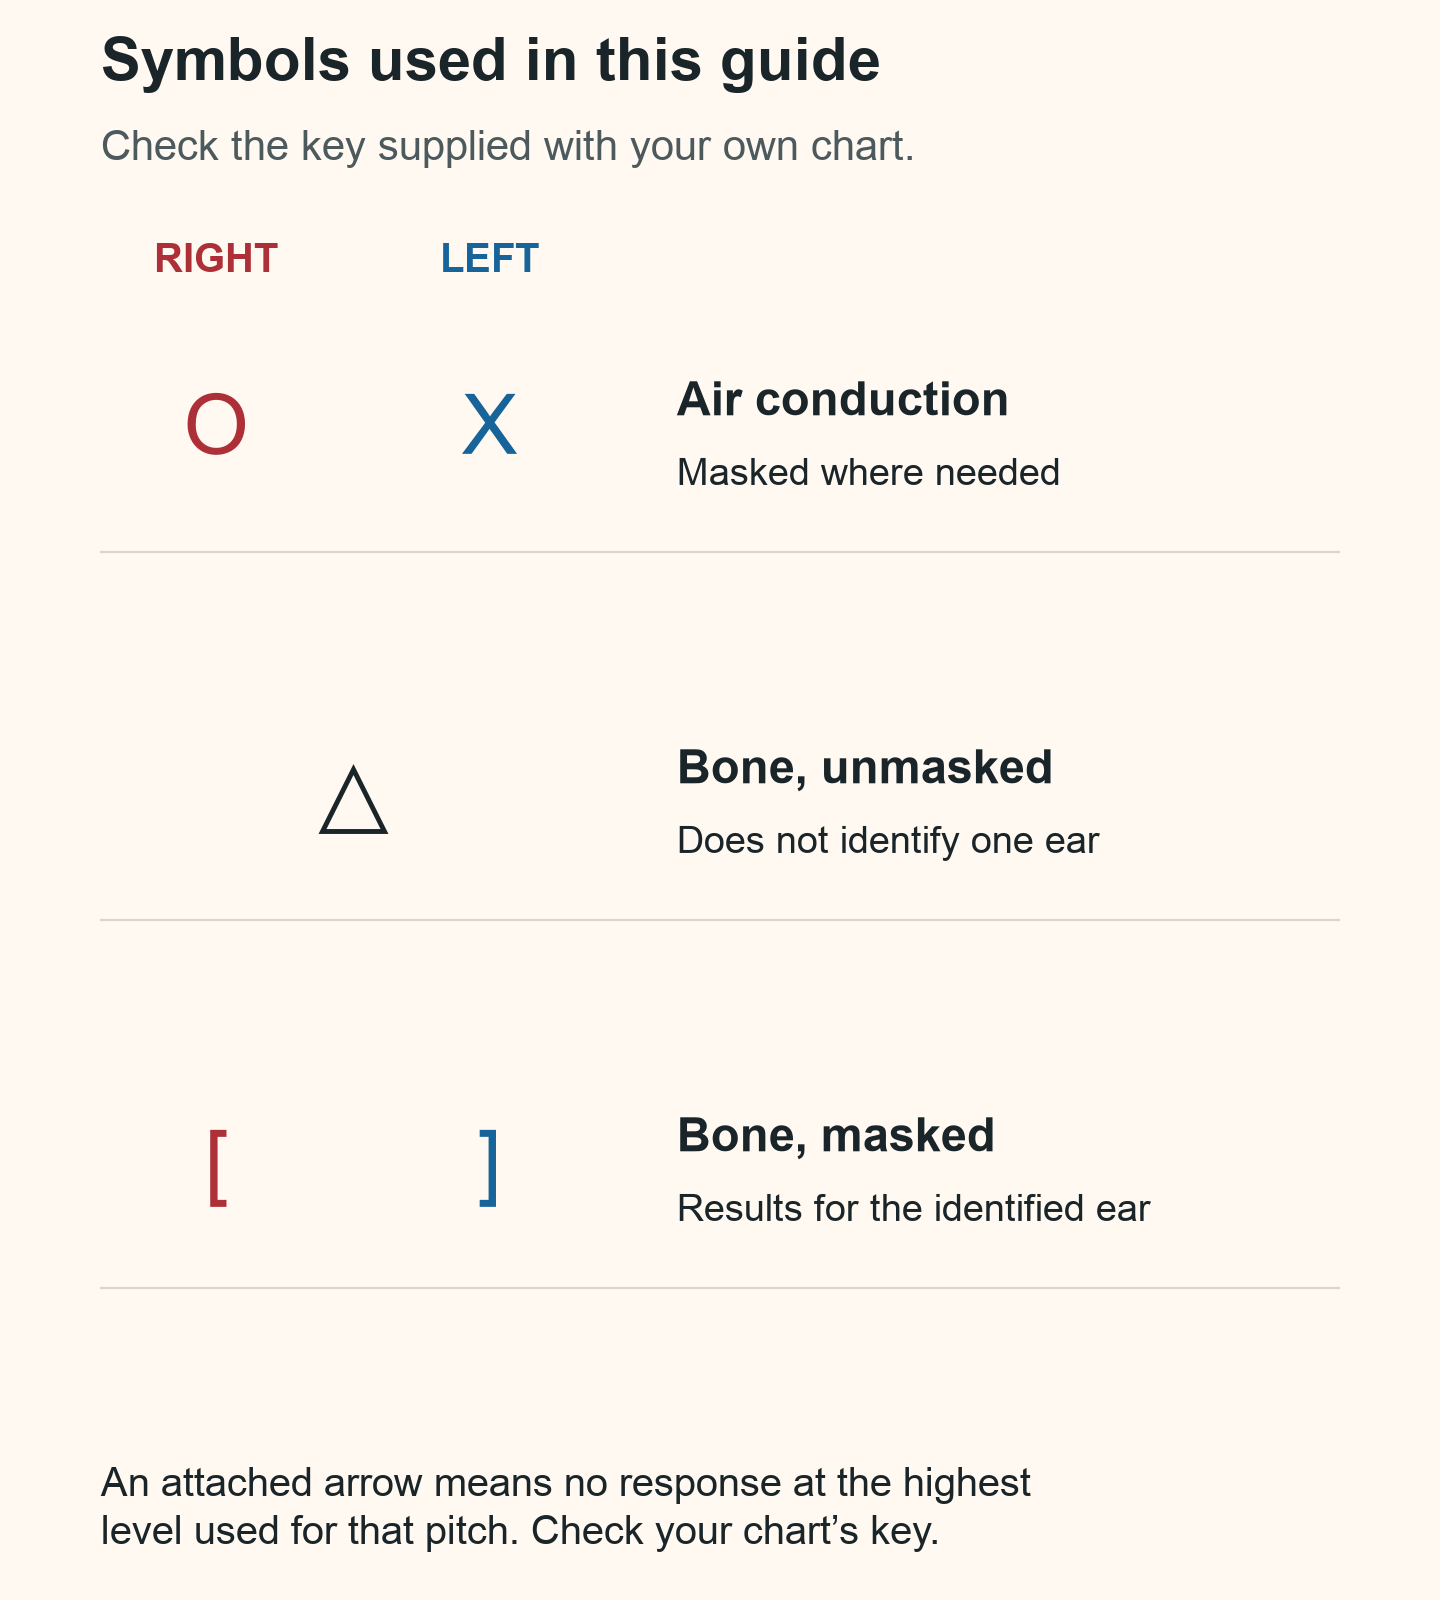
Circles usually show the right ear and crosses the left. They are commonly red and blue, but the symbols identify the ears on a black-and-white printout too.
Air and bone conduction
Circles and crosses normally record air-conduction testing through headphones or inserts. Sound travels through the outer and middle ear to the inner ear.
Bone conduction uses a small vibrating device, usually placed behind the ear. Comparing air- and bone-conduction results helps the audiologist investigate whether the outer or middle ear is affecting how sound reaches the inner ear.
Masking is noise played to the other ear to help establish which ear detected a tone. Some symbols show that masking was used. An arrow attached to a symbol means there was no response at the highest level used for that pitch.
Check the key on your own chart. Software can use different symbols, particularly for bone conduction and masked results.
Mild, moderate, severe and profound hearing loss
These terms describe measured hearing levels. The British Society of Audiology (BSA) uses the following ranges, based on the average air-conduction thresholds at 250, 500, 1,000, 2,000 and 4,000 Hz for each ear.
| Description | Average hearing threshold |
|---|---|
| Mild | 21–40 dB HL |
| Moderate | 41–70 dB HL |
| Severe | 71–95 dB HL |
| Profound | More than 95 dB HL |
An average can hide differences between pitches. You may hear lower pitches relatively well while needing much more level at higher pitches. Your audiologist should explain that pattern as well as the overall description.
Other classification systems use different boundaries. The BSA advises that these descriptors should not determine hearing support on their own.
Mild hearing loss can still make conversation difficult
Someone who spends the day in meetings and goes home to a busy household may struggle repeatedly with a mild measured loss. Voices overlap, people speak from further away and there is little chance to fill in a missed word.
Someone with a severe measured loss may report fewer difficulties if their usual conversations are one-to-one, face-to-face and in familiar surroundings. The same person may find a restaurant or group gathering much harder.
These examples explain why we avoid saying someone has “only” a mild hearing loss. The amount of hearing loss matters, alongside the demands of daily life, speech understanding and any support already in place. A severe result does not mean help is hopeless, and a mild result is no reason to dismiss someone’s difficulties.
What else do we check?
Hearing a test tone and following a conversation are different tasks. An audiogram cannot tell us exactly how you cope with competing voices or background noise.
At Alto, speech-in-noise testing helps us investigate those difficulties. We consider the result alongside your audiogram and the situations you describe.
We also look at your ear examination and history. Air- and bone-conduction results can help distinguish conductive loss, involving the outer or middle ear, from sensorineural loss, involving the inner ear or hearing nerve. A mixed loss includes both. The chart alone cannot confirm the cause.
Choosing hearing support takes more than a graph. Your communication needs, ear health, physical fitting and ongoing care all affect the recommendation. NICE guidance also recommends discussing difficulties that may not be obvious from the audiogram.
Discussing your own results
Tell your audiologist about the conversations you miss and any situations you have started avoiding. “I lose track when everyone talks at dinner” gives us something specific to investigate.
You should leave the discussion understanding which pitches are affected, how the ears compare and why the recommended next step is hearing support, further investigation or monitoring.
Our guide to what happens at a Complete Hearing Assessment explains how we bring these findings together.
Talk to Alto about your hearing
If conversations are becoming harder, we can discuss a Complete Hearing Assessment. Your audiologist will explain the results alongside the difficulties you have noticed and recommend the next step for your care.
Request a call back